a5_composite_picture_and_ink Function
Syntax
Arguments
- pictureAny Type
The background picture. Picture can be a base64 encoded image, a file name, or blob image field.
- inkCharacter
The ink data that will be overlaid on top of the background picture.
- basepathCharacter
Optional. Defines a base path used to convert a relative image filename stored in the picture filed into an absolute filename. Basepath is only required if picture contains an Image File Reference.
Description
Creates a composite annotated image created from a picture field and an ink field.
Discussion
a5_composite_picture_and_ink() generates a composite image by combining a background picture with ink data. This function takes the name of the field that contains the picture, the name of the field that contains the ink, and (optionally) a base path. It creates a composite image with the ink overlaid on top of the picture. The object returned by this function is a mime object. See *mime_object for more information about the mime object.
Example
For example, assume that your database has fields called picture1 and annotation1 and you want to print the ink in annotation1 over the picture in picture1. You could create a calculated field called compositeImage and add this calculated field to your report.
compositeImage = a5_composite_picture_and_ink(picture1,annotation1)
How to Convert SVG Composite Image to Another Format
The composite result from a5_composite_picture_and_ink function can be converted to another file type, such as a PNG or JPEG file. This is done by converting the SVG stored in the mime object returned by the function to another format. For example:
dim composite as p = a5_composite_picture_and_ink(image_blob,ink_data)
dim svg as c = composite.toString()

dim scanner as p
scanner = stringScanner.Create(svg)
if (scanner.replaceSmatchI("style=\"width:*; height:*;","style=\"width:1024px; height:768px;")) then
    svg = scanner.Text
end if

dim jpegImage as b = charting::Chart::SvgToJpeg(svg)

file.from_blob("c:\testPhoto.jpeg",jpegImage)

sys_open("c:\Carol\testPhoto.jpeg")
Caveats
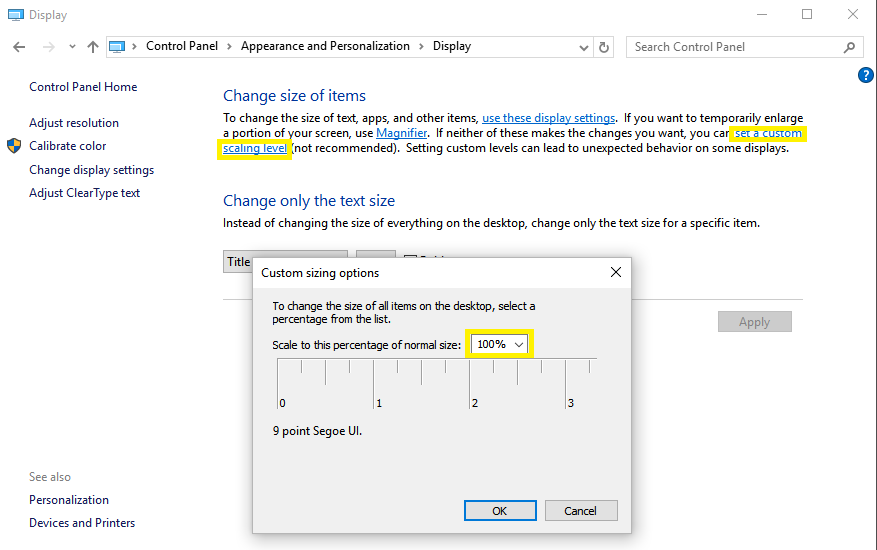
The Windows 10 custom scaling feature can interfere with the sizing of the SVG produced by the a5_composite_picture_and_ink function.
If you are running under Windows 10, and Best Fit images in reports are showing up smaller than the space provided check the Control Panel/Appearance and Personalization / Display Dialog, and make sure that the scaling is set to the default of 100%.
Credit goes to Ted Thomas for discovering this issue.
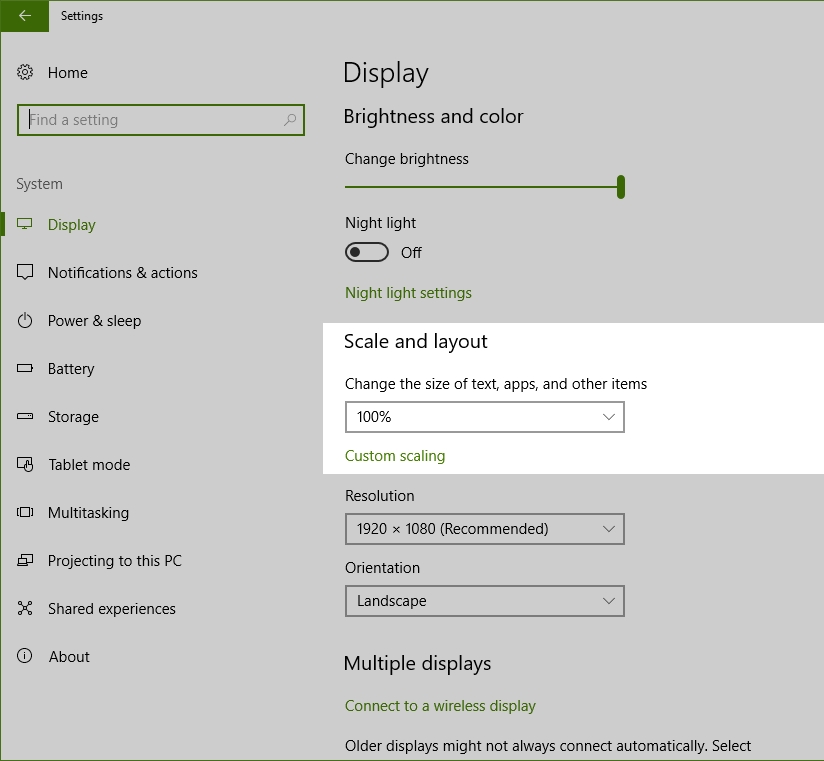
Scaling on Windows 10 Build 15019+
As of Windows 10 Build 15019, the Scaling options have moved. They can be found in Settings > System > Display > Custom scaling:
See Also